
US renewable energy credit market size to double to $26 billion by 2030
Case StudyA Leading Renewable Energy Financing Bank Gains Important Insights on U.S.- based Opportunities
Exploring the Energy Dynamics of AI Datacenters: A Dual-Edged Sword
Despite turmoil, project finance remains keen on offshore wind
Case StudyAn Energy Company Assesses Datacenter Demand for Renewable Energy
Renewable energy credits, also known as renewable energy certificates, or RECs, are seeing an increase in attention in the U.S. energy market due to expanding state-level renewable and clean energy standards, the growing corporate renewables market and the Inflation Reduction Act. According to S&P Global Commodity Insights' analysis and forecasts, the U.S. REC market as of 2021 was valued at $11.45 billion but is forecast to swell to $26.5 billion by the end of the decade.
The REC market as of 2021 was estimated to be $11.45 billion, with the compliance market making up 95% of that value. The S&P Global Market Intelligence Power Forecast projects the REC market to more than double to $26.5 billion by 2030. While the compliance market remains dominant, its share over the voluntary market is expected to shrink to 76% by the end of the decade. The solar carve-out is forecast to slowly grow from $3.2 billion in 2022 to $3.6 billion by 2030. Driven by robust offshore REC prices, the offshore wind REC market should explode from almost nonexistent to nearly $3.6 billion by 2030.
Regionally, the West is the largest market, both in terms of generation and market size. Outpacing second-place PJM, the West is forecast to reach $9.1 billion by 2030, though our upside scenario projects the region surpassing $13 billion. PJM's REC market is forecast to nearly double from $2.8 billion to $5.3 billion. New York ISO, ISO New England and the Midcontinent ISO round out the top five, respectively.

REC market size as of 2021
S&P Global Commodity Insights collected and analyzed data from 10 REC tracking systems and various state and utility compliance reports to estimate the current REC market volume in terms of megawatt-hour and dollar values. Over half a million RECs were estimated to be retired and used in either a compliance or voluntary REC market in 2021, with the total value estimated at $11.45 billion.
The compliance market, which includes RECs retired to meet state-level renewable portfolio standards, or RPSs, and solar RECs to meet solar carve-out requirements, accounted for nearly two-thirds of the total volume of retired RECs in 2021. In terms of monetary value, however, the compliance market makes up over 95% of the overall market. This is expected, given that compliance RECs are typically priced much higher than their voluntary counterparts. The estimated average cost for compliance RECs in 2021 was $33.94 per credit compared to $3.00 per credit for voluntary RECs.
The Western Renewable Energy Generation Information System, or WREGIS, covers most of the Western Interconnect and is the largest of the REC tracking systems by coverage area. Not surprisingly, it ranked as the largest market in 2021 in quantity and total value of RECs. Included in WREGIS' territory is renewable energy market trailblazer California, along with the burgeoning markets of Colorado, Nevada, New Mexico and Oregon. According to WREGIS, roughly 60% of retired RECs in 2021 went to California, amounting to more than 100 million RECs.
The next-ranked region by 2021 REC market size was PJM Interconnection LLC. The 2021 REC market value in PJM is estimated at just over $2.4 billion, based on approximately 76 million retired RECs. That represents an estimated average cost of $32.22 per credit, driven by the RPS compliance markets in Delaware, Maryland, New Jersey, Ohio, Pennsylvania and Virginia.
The Midwest Renewable Energy Tracking System, which tracks most of the REC transfers and retirements within the Midcontinent ISO, ranks second by 2021 REC total, with more than 115 million retired RECs cumulatively valued at nearly $1.5 billion. The New England Power Pool Generation Information System, or NEPOOL-GIS, covers the ISO New England territory and is comparatively small with 32 million retired RECs in 2021 but is also one of the more lucrative REC markets, ranking fourth among the 10 REC tracking systems in terms of 2021 value at nearly $1.5 billion and first in terms of cost per REC at an estimated $45.18. ISO New England is the only multistate system operator in which every state has a mandatory RPS.
REC market forecast
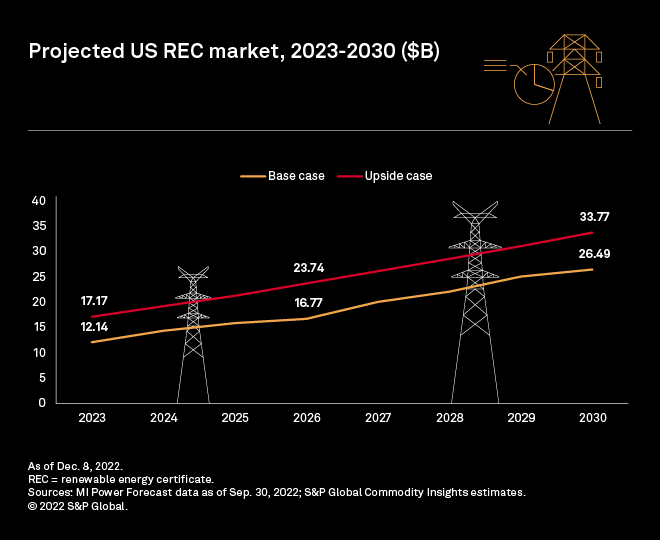
S&P Global Market Intelligence leveraged the REC prices from its Power Forecast to generate an annual projected REC market size through 2030. Referred to in this study as the "base case," this forecast shows the U.S. REC market more than doubling from about $12.1 billion in 2023 to about $26.5 billion by 2030. An additional scenario was generated utilizing current REC prices by state and market and applying a steady annual growth rate of 2.5%. This scenario, referred to as the "upside case," shows a more lucrative REC market of more than $17.1 billion in 2023, growing to nearly $33.8 billion by 2030.
Compliance market
Renewable portfolio standards drive the REC market as power providers in states with an RPS utilize RECs to demonstrate compliance with local renewable energy requirements. Generally aiming at minimum renewable loads in overall power supply, RPS targets rise over time, essentially showing the way for the overall U.S. REC market. Currently, the S&P Global Market Intelligence Power Forecast models RPS megawatt-hour targets for 27 states. The base REC market case suggests the compliance segment of the U.S. REC market could generate more than $10.2 billion in 2023 and rise to nearly $20.1 billion by 2030, while the upside case points to more than $15.3 billion in 2023 and a little over $28.1 billion by 2030.
Developments difficult to anticipate, such as the adoption of renewable portfolio standards in states currently without an RPS or the acceleration of targets under existing RPSs, could further steepen the market's trajectory. On the other hand, policymakers in states without an RPS may assess that local mandates to develop renewable energy are no longer necessary, considering green energy commitments in the private market, the Inflation Reduction Act and the energy security imperatives brought to the fore by Russia's invasion of Ukraine and the subsequent impact on global fossil fuel markets.
Solar carve-outs
Solar carve-outs are part and parcel of most renewable portfolio standards, requiring that specific amounts of the mandated renewable power supplies be met by solar energy. For example, Maryland had a solar carve-out of 6% by 2020, with built-in escalators bringing the metric to 14.5% by 2030. Per its RPS, Washington, D.C., aimed for a 2.175% solar carve-out in 2020, targeting 10% by 2041.
Policymakers originally devised solar carve-outs to promote photovoltaic energy, which historically has trailed wind by a non-negligible margin in the U.S. Today, the mechanism arguably is falling into disuse as renewable energy developers ramp up solar — a generally less expensive, faster-to-develop technology than wind. The U.S. has a utility-scale solar pipeline of approximately 215 GW, compared to 120 GW for wind. This trend is expected to weigh on solar REC prices, keeping the solar REC market in check. Our base forecast shows the solar compliance REC market hovering between $3.5 billion and $3.8 billion from 2023 through 2030. Meanwhile, our upside case suggests the segment could top $4.1 billion by 2030.
Offshore wind
A relatively recent phenomenon, U.S. offshore wind targets aim to bridge the significant gap with Western Europe and China on the maritime wind front. In an online fact sheet published March 29, 2021, the White House announced a target of 30 GW of offshore wind across the U.S. by 2030. Multiple coastal states, notably along the U.S. Atlantic seaboard, have announced offshore wind targets. In New England, for example, Massachusetts is aiming for 5.6 GW of offshore wind by 2035. A bit farther south, New York is working toward at least 9 GW of offshore wind by 2035. Farther to the south, Virginia plans 5.2 GW of offshore wind by 2034, and North Carolina plans 8 GW by 2040.
Market Intelligence projects a nearly $16 million offshore wind REC market for 2023, rising to roughly $3.6 billion by 2030. Unlike solar, however, offshore wind may require additional support — perhaps even nudges — from policymakers across the outlook, notably to develop the technology in the Gulf of Mexico and on the West Coast. Our compliance offshore wind REC forecast could prove conservative as a result.
Voluntary market
As the name implies, the voluntary market stems from dynamics beyond mandates, notably consumer demand for green energy and commitments by power suppliers, generally on environmental grounds, to transition away from fossil fuels. As discussed above, heightened energy security concerns in the wake of recent geopolitical developments are magnifying these trends. The International Energy Agency, in its "2022 Renewables" report published Dec. 6, anticipates that from 2022 through 2027, global renewable capacity will increase by 2.4 GW, which is 30% higher than the IEA's forecast a year ago.
Voluntary megawatt-hours are expected to account for over 59% of all projected U.S. renewable megawatt-hours in 2023 and to top the two-thirds threshold in the second half of the outlook. Ultimately, however, lower prices make the voluntary REC market less attractive to developers, limiting its growth. It is nonetheless expected to rise quickly during the interval under consideration, from about $1.9 billion in 2023 to $6.4 billion by 2030.
Regional overview
ISO New England is expected to remain the smallest market among the eight regions delineated in this analysis in terms of megawatt-hour demand for renewable energy despite increasingly aggressive renewable and clean energy targets across the region. Consistently forecast high-priced RECs combined with robust solar carve-out and offshore wind REC markets make it the fourth-largest market in total REC value according to the base scenario, at $2.9 billion.
Buoyed by an expected surge in offshore wind generation in Maryland, New Jersey and Virginia by the end of the decade, REC quantities in PJM are projected to nearly quadruple from about 78 million in 2023 to slightly over 300 million by 2030. This volume, compounded by robust REC prices for the offshore power and remunerative solar carve-out markets in Maryland and New Jersey, make PJM the second-largest REC market in the country by 2030 at $5.3 billion in our base scenario. The upside case projects a noteworthy $8.7 billion REC market in the region within the same time frame. Fueled by the Clean Economy Act, passed in 2020, and its aforementioned offshore wind commitment, Virginia is forecast to have an estimated REC market value of $1.3 billion by 2030, the largest in PJM.
The West is expected to remain the dominant renewable market in the U.S. through 2030 as the region continues to leverage its unrivaled combination of aggressive clean energy legislation, wind and solar resources, and undeveloped land. Over 480 million RECs are forecast to be generated annually by 2030 in the West, and with many needed for RPS compliance, the market is projected to soar past $9 billion by the end of the decade. The upside scenario sees a market potential of just over $13 billion by 2030.
Not surprisingly, California leads all states in the West and the rest of the country, with its REC market value rising to $5.6 billion by 2030, meaning California alone would make the West the largest REC market in the country. Offshore wind is not currently included in California's market potential as the industry is still in its infancy in the West. The state implemented an offshore wind capacity target of 25 GW by 2045 and has held its first offshore wind auction, which concluded in early December. The maturation of offshore wind activity along the U.S. West Coast will only strengthen California's position as a leader in clean energy deployment.
MISO is forecast to jump to the top in renewable energy generation among the eight regions designated in this analysis, nudging the West out of the lead by 2030. Driven by planned retirements of coal plants and economic renewable development energized by the Inflation Reduction Act, MISO is expected to be one of the most active regions for wind and solar development in the country over the next decade. That said, a substantial portion of the forecast generation in MISO is expected to fall to the voluntary market, capping the market size at $2.8 billion by 2030, though the upside scenario projects MISO's REC market rising to $3.6 billion by the same time.
The image below is a video presentation; please click on the image to access controls for play, pause, and moving to specific video frames. To view the video in full screen, please click the square at the bottom right of the video player; to exit full-screen view, please click "x" or press the "Esc" key.
Key takeaways
The energy transition away from fossil fuel will turn RECs into a roughly $30 billion market in the U.S. by 2030. Compliance is the backbone of the market, but voluntary megawatt-hours are expected to overtake mandatory production in 2023, rising to more than two-thirds of total U.S. renewable generation by 2026 and beyond. With voluntary REC prices significantly lower than their compliance counterpart, however, the compliance dollar volume accounts for between 76% and 84% of the overall U.S. REC market throughout the outlook.
Methodology
Modeling the U.S. REC market involved multiple steps. First, we aggregated the S&P Global Market Intelligence's Power Forecast projections for minimum renewable energy generation to meet RPS targets and overall state-level renewable megawatt-hour production from 2023 through 2030. Second, we leveraged Power Forecast REC price estimates to model the compliance market, then the voluntary segment. Solar carve-outs and offshore wind targets were isolated within broad state-level RPS mandates. Following a similar process, we applied a steady, base annual growth rate of 2.5% to 2021 REC price estimates, yielding an additional "upside" scenario.
For wholesale prices and supply and demand projections, see the S&P Global Market Intelligence Power Forecast.
Regulatory Research Associates is a group within S&P Global Commodity Insights.
S&P Global Commodity Insights produces content for distribution on S&P Capital IQ Pro.
Monesa Carpon, Chris Allen Villanueva and Joseph William Reyes contributed to this article.
This article was published by S&P Global Market Intelligence and not by S&P Global Ratings, which is a separately managed division of S&P Global.